The “Expensive” Price That Turned Out to Be Cheap
To illustrate, let’s use the historical data of QQQ, the Nasdaq ETF.
Take a look at the chart below.
Would you buy here?
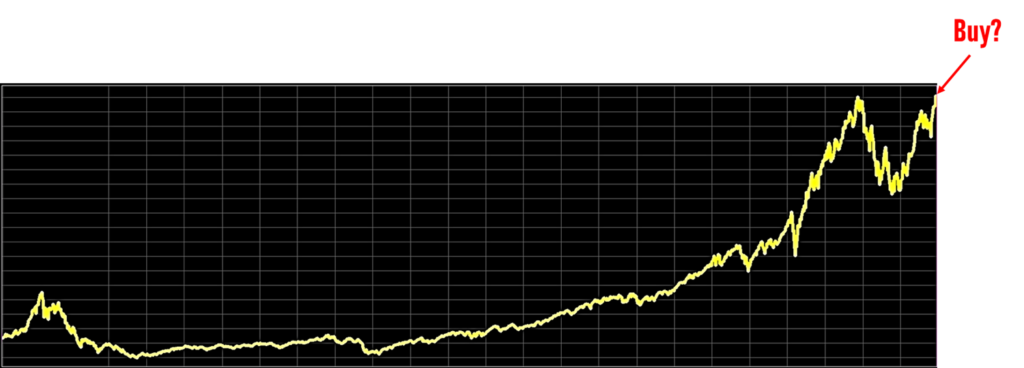
If you’re the kind of investor who’s always waiting for “the next dip,” the answer is probably no.
After all, technical analysts might even point to overhead resistance and argue that the upside is limited.
So you wait.
And while you’re waiting, the market keeps climbing.
Eventually, the pullback you’ve been waiting for finally arrives.
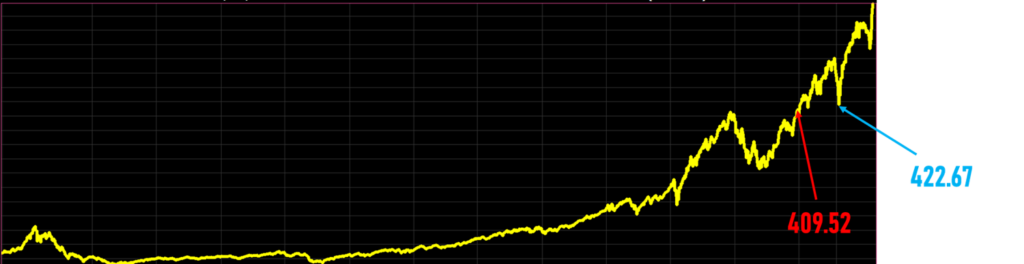
However,
the “dip” (blue arrow) actually occurs at a higher price than the level you previously considered too expensive (red arrow).
- $409.52: “Too expensive. I’ll wait.”
- $422.67: “Finally! A pullback. Time to buy.”
The red arrow represents what you call an expensive price that later proved to be cheap.
The blue arrow represents a cheap-looking price that was actually more expensive.
Because of anchoring bias, sometimes, the price you were afraid to pay turns out to be the cheapest price you’ll ever see.
The market often rewards the price you were afraid to pay—not the one you patiently waited for.
Why We’re Afraid of All-Time Highs
For many investors, an all-time high feels like a warning sign.
“It’s gone up too much.”
“Surely it has to come back down.”
If you genuinely believe that the stock market will continue creating value over the long run,
then new all-time highs shouldn’t surprise you. They should be expected.
A growing market, by definition, spends a surprising amount of time making new highs.
So here’s an interesting question.
What if you were unlucky enough to buy at the highest price every single year?
Most people assume the outcome would be disastrous.[2] :
The data tells a different story.
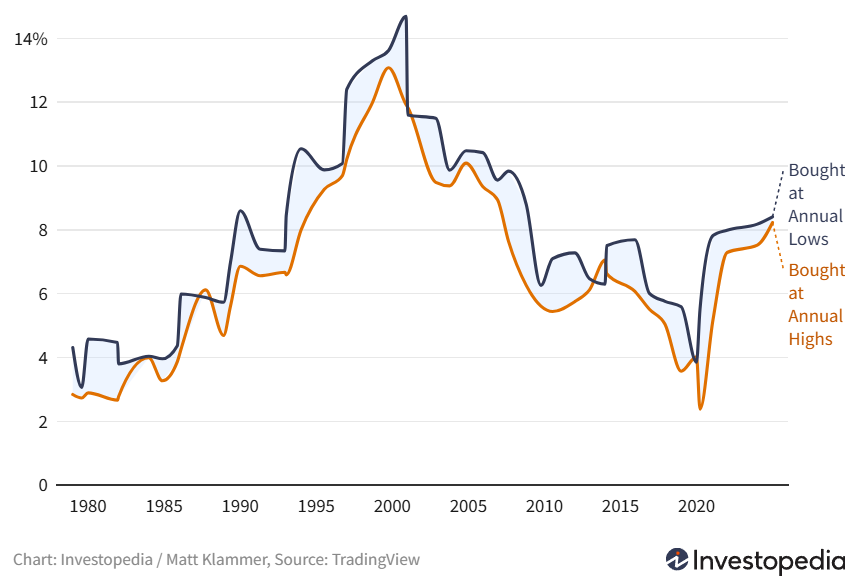
The chart above compares two hypothetical investors in the S&P 500 over roughly two decades:
One buys at the lowest price of each year.
The other buys at the highest price of each year.
As expected, buying at the annual low produces better returns.
But the gap is much smaller than most people imagine.
More importantly, neither scenario reflects reality.
You are extraordinarily unlikely to buy at the highest point every year.
You’re equally unlikely to buy at the lowest point every year.
Real investors buy somewhere in between.
The evidence suggests that buying near the top isn’t nearly as damaging as most people fear.
All-Time Highs Are More Common Than Most People Think
Many investors treat an all-time high as if it’s a rare signal that the market has become dangerously overheated.
Historically, that’s simply not true.
During the 1990s, more than 12% of all trading days in the S&P 500 closed at a new all-time high.
From 2013 to 2019, that figure increased to 14%.
Even after experiencing two major bear markets in the 21st century,
the S&P 500 still recorded new all-time highs on roughly 11% of trading days during the 2020s[4].
In other words, all-time highs are not exceptions—they’re a normal feature of long-term bull markets.
That doesn’t mean markets can’t fall after reaching a new high.
Of course they can.
It simply means that an all-time high, by itself,
is not reliable evidence that the market has become overvalued or that a crash is imminent.
The historical evidence is surprisingly reassuring [5].
Since 1950, after the S&P 500 reached a new all-time high,
the probability of experiencing a decline of more than 10% within the following year has been only about 9%.
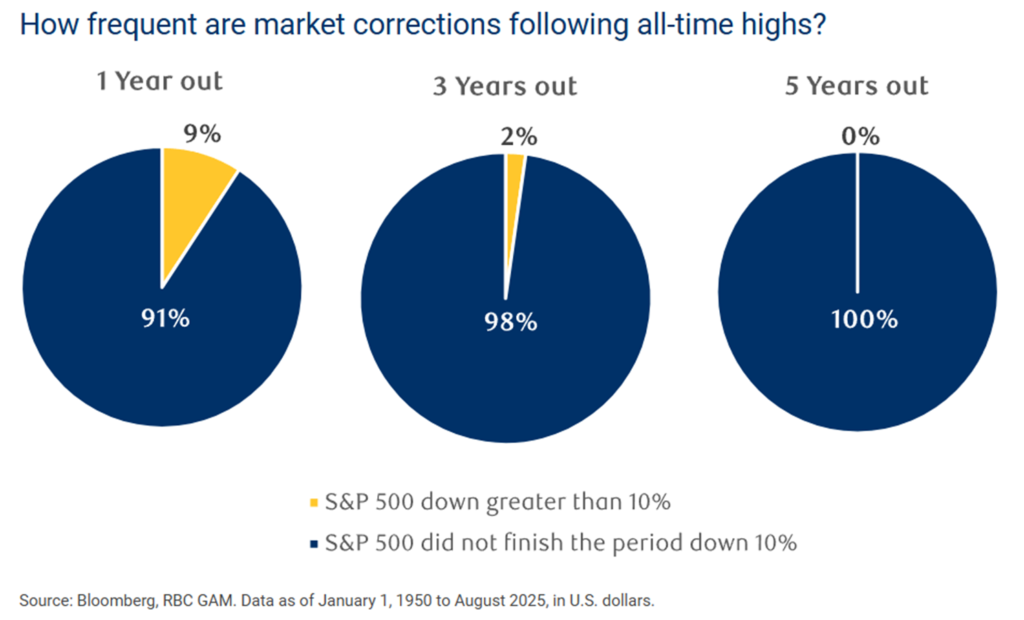
Over longer holding periods, the odds improve even further.
In fact, when measured five years after each all-time high since 1950,
the S&P 500 has never remained more than 10% below that previous peak.
That’s a useful reminder of how long-term investing works.
The market frequently reaches new highs—not because it’s irrational,
but because productive businesses continue to grow, innovate, and generate earnings over time.
Should You Buy at All-Time Highs?
Still feel uncomfortable buying when the market is making new highs?
Let’s look at an even more direct question.
What actually happens if you buy at an all-time high?
Rather than relying on anecdotes, let’s turn to the data.
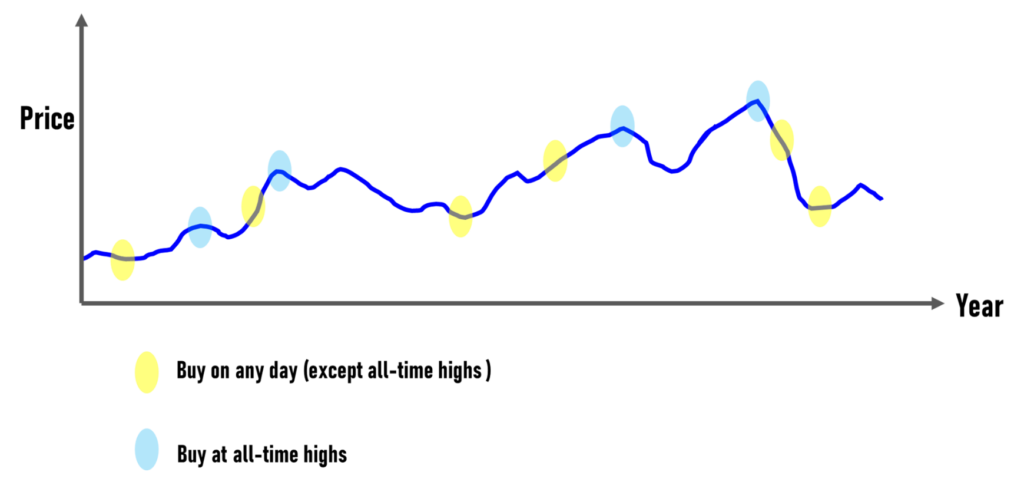
This study examined the S&P 500 from 1950 through 2025 and compared two groups of investors:
- Yellow dots: Every possible trading day except all-time highs.
- Blue dots: Every trading day that marked a new all-time high.
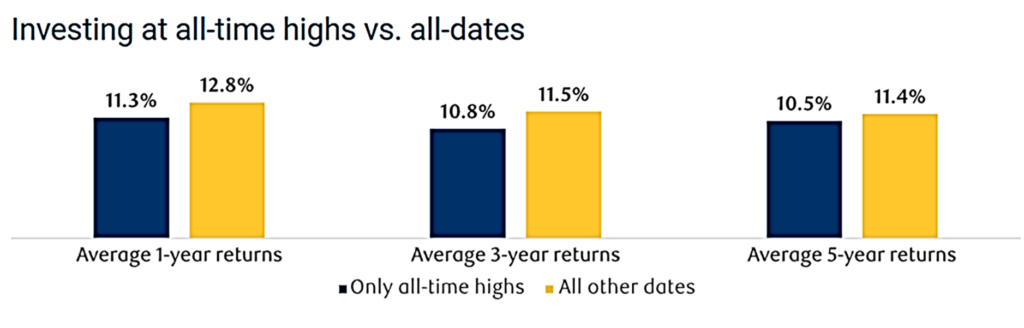
For each purchase date, the study measured the average return over the following 1 year, 3 years, and 5 years.
That means:
More than 10,000 one-year return observations for ordinary trading days.
More than 1,000 one-year return observations for all-time highs.
And, it suggests [5]:
This comparison focuses on average returns.
It does not compare risk-adjusted measures such as volatility, maximum drawdown, or the Sharpe ratio.
Even with that limitation, the findings are surprisingly consistent.
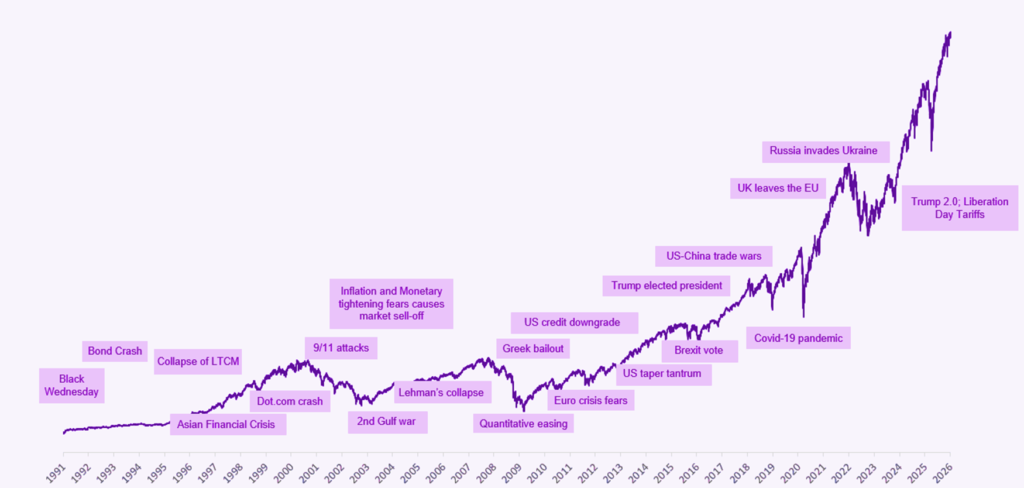
The dataset spans some of the most turbulent periods in modern financial history—
from the early 1990s through the dot-com crash,
the Global Financial Crisis, the COVID-19 pandemic, and many other major market events [6].
Despite all of those crises,
investors who bought at all-time highs did not experience dramatically worse one-year returns than those who bought on ordinary trading days.
Why?
Because all-time highs are often a characteristic of strong, healthy bull markets
—not necessarily a sign that the market has become irrational.
When the market approaches record highs, many investors move into cash and wait patiently for a significant correction.
Sometimes that correction arrives.
Quite often, it doesn’t.
Instead, the market continues climbing, leaving those investors watching from the sidelines.
To be clear, this isn’t telling you to purposely buy at all-time highs. Look at the chart below:
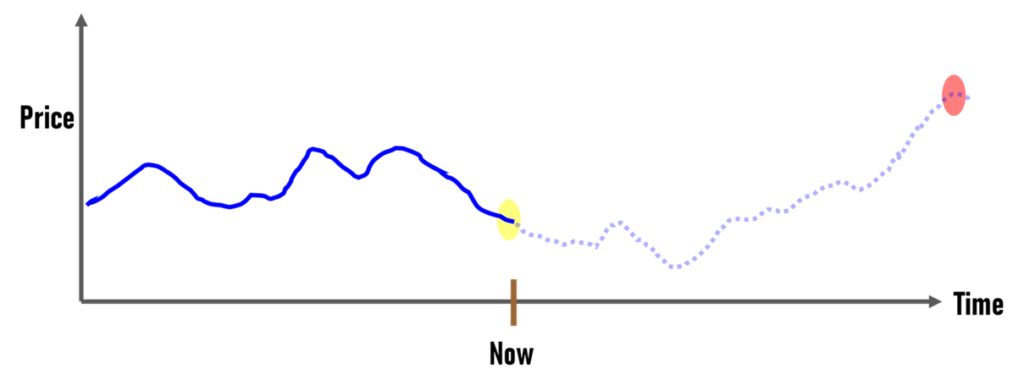
If you pass on buying now (yellow circle) just to wait for an all-time high (red circle),
you are completely missing out on the entire rally from yellow to red.
The opportunity cost is real—and it’s often invisible.
The biggest lesson from 75 years of S&P 500 data is surprisingly simple:
If your investment thesis hasn’t changed, an all-time high alone shouldn’t stop you from investing.
Otherwise, the opportunity cost of waiting may become far more expensive than the correction you’re trying to avoid.
As Peter Lynch famously said:
Final Thoughts
Being overly cautious often makes us feel wiser.
It doesn’t necessarily make us better investors.
Risk awareness is essential.
Trying to consistently predict the market’s next correction is something entirely different.
Bull markets eventually become bear markets.
Bear markets eventually recover.
That’s simply how markets work.
The problem is that nobody knows exactly when those turning points will occur.
History offers another important lesson.
A remarkably small number of trading days account for a disproportionately large share of long-term market returns [6].
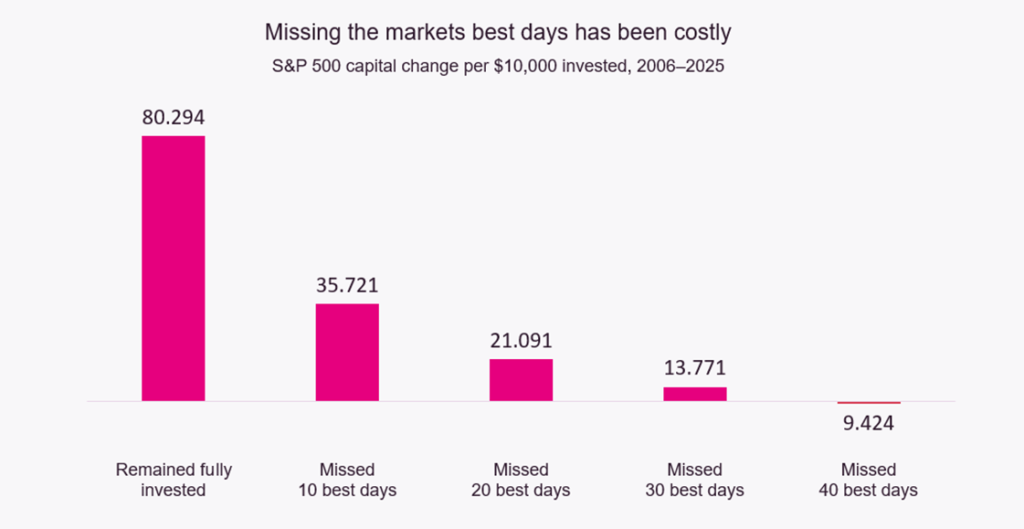
The market’s best days and worst days can only be identified in hindsight.
You only know the best and worst days after the fact.
In the moment, you never truly know.
What’s more, they often occur surprisingly close to one another.
Investors who try to avoid the worst days frequently end up missing the best ones as well.
This is one of the strongest arguments for staying invested rather than constantly trying to time the market.
The market doesn’t reward perfection.
It rewards patience.
For long-term investors, the best time to invest may have been ten years ago.
The second-best time is today—even if today feels like the worst possible time to buy.
Reference :
[1] You Jumped Over a Puddle and Fell Into a Lake
[2] Trading Strategies for Stocks at All-Time Highs: Essential Risk Management Rules, Investopedia
[3] Is it worth considering investing at all-time highs? J.P.Morgan
[4] All-Time Highs in the Stock Market are Usually Followed by More All-Time Highs
[5] Investing at all-time highs
[6] Missing the Market’s Best Days Why Staying Invested Matters
Leave a Reply